Shixin Liang

Design One-Pager  ·  Portfolio Documentation

SAP Sapphire
CIO Keynote
2026

Communication Designer
Michael Ameling Keynote Team
SAP Sapphire · Orlando, FL · May 12, 2026
SAP Sapphire · Madrid · May 19–21, 2026
Stat Reveal + Icon Choreography
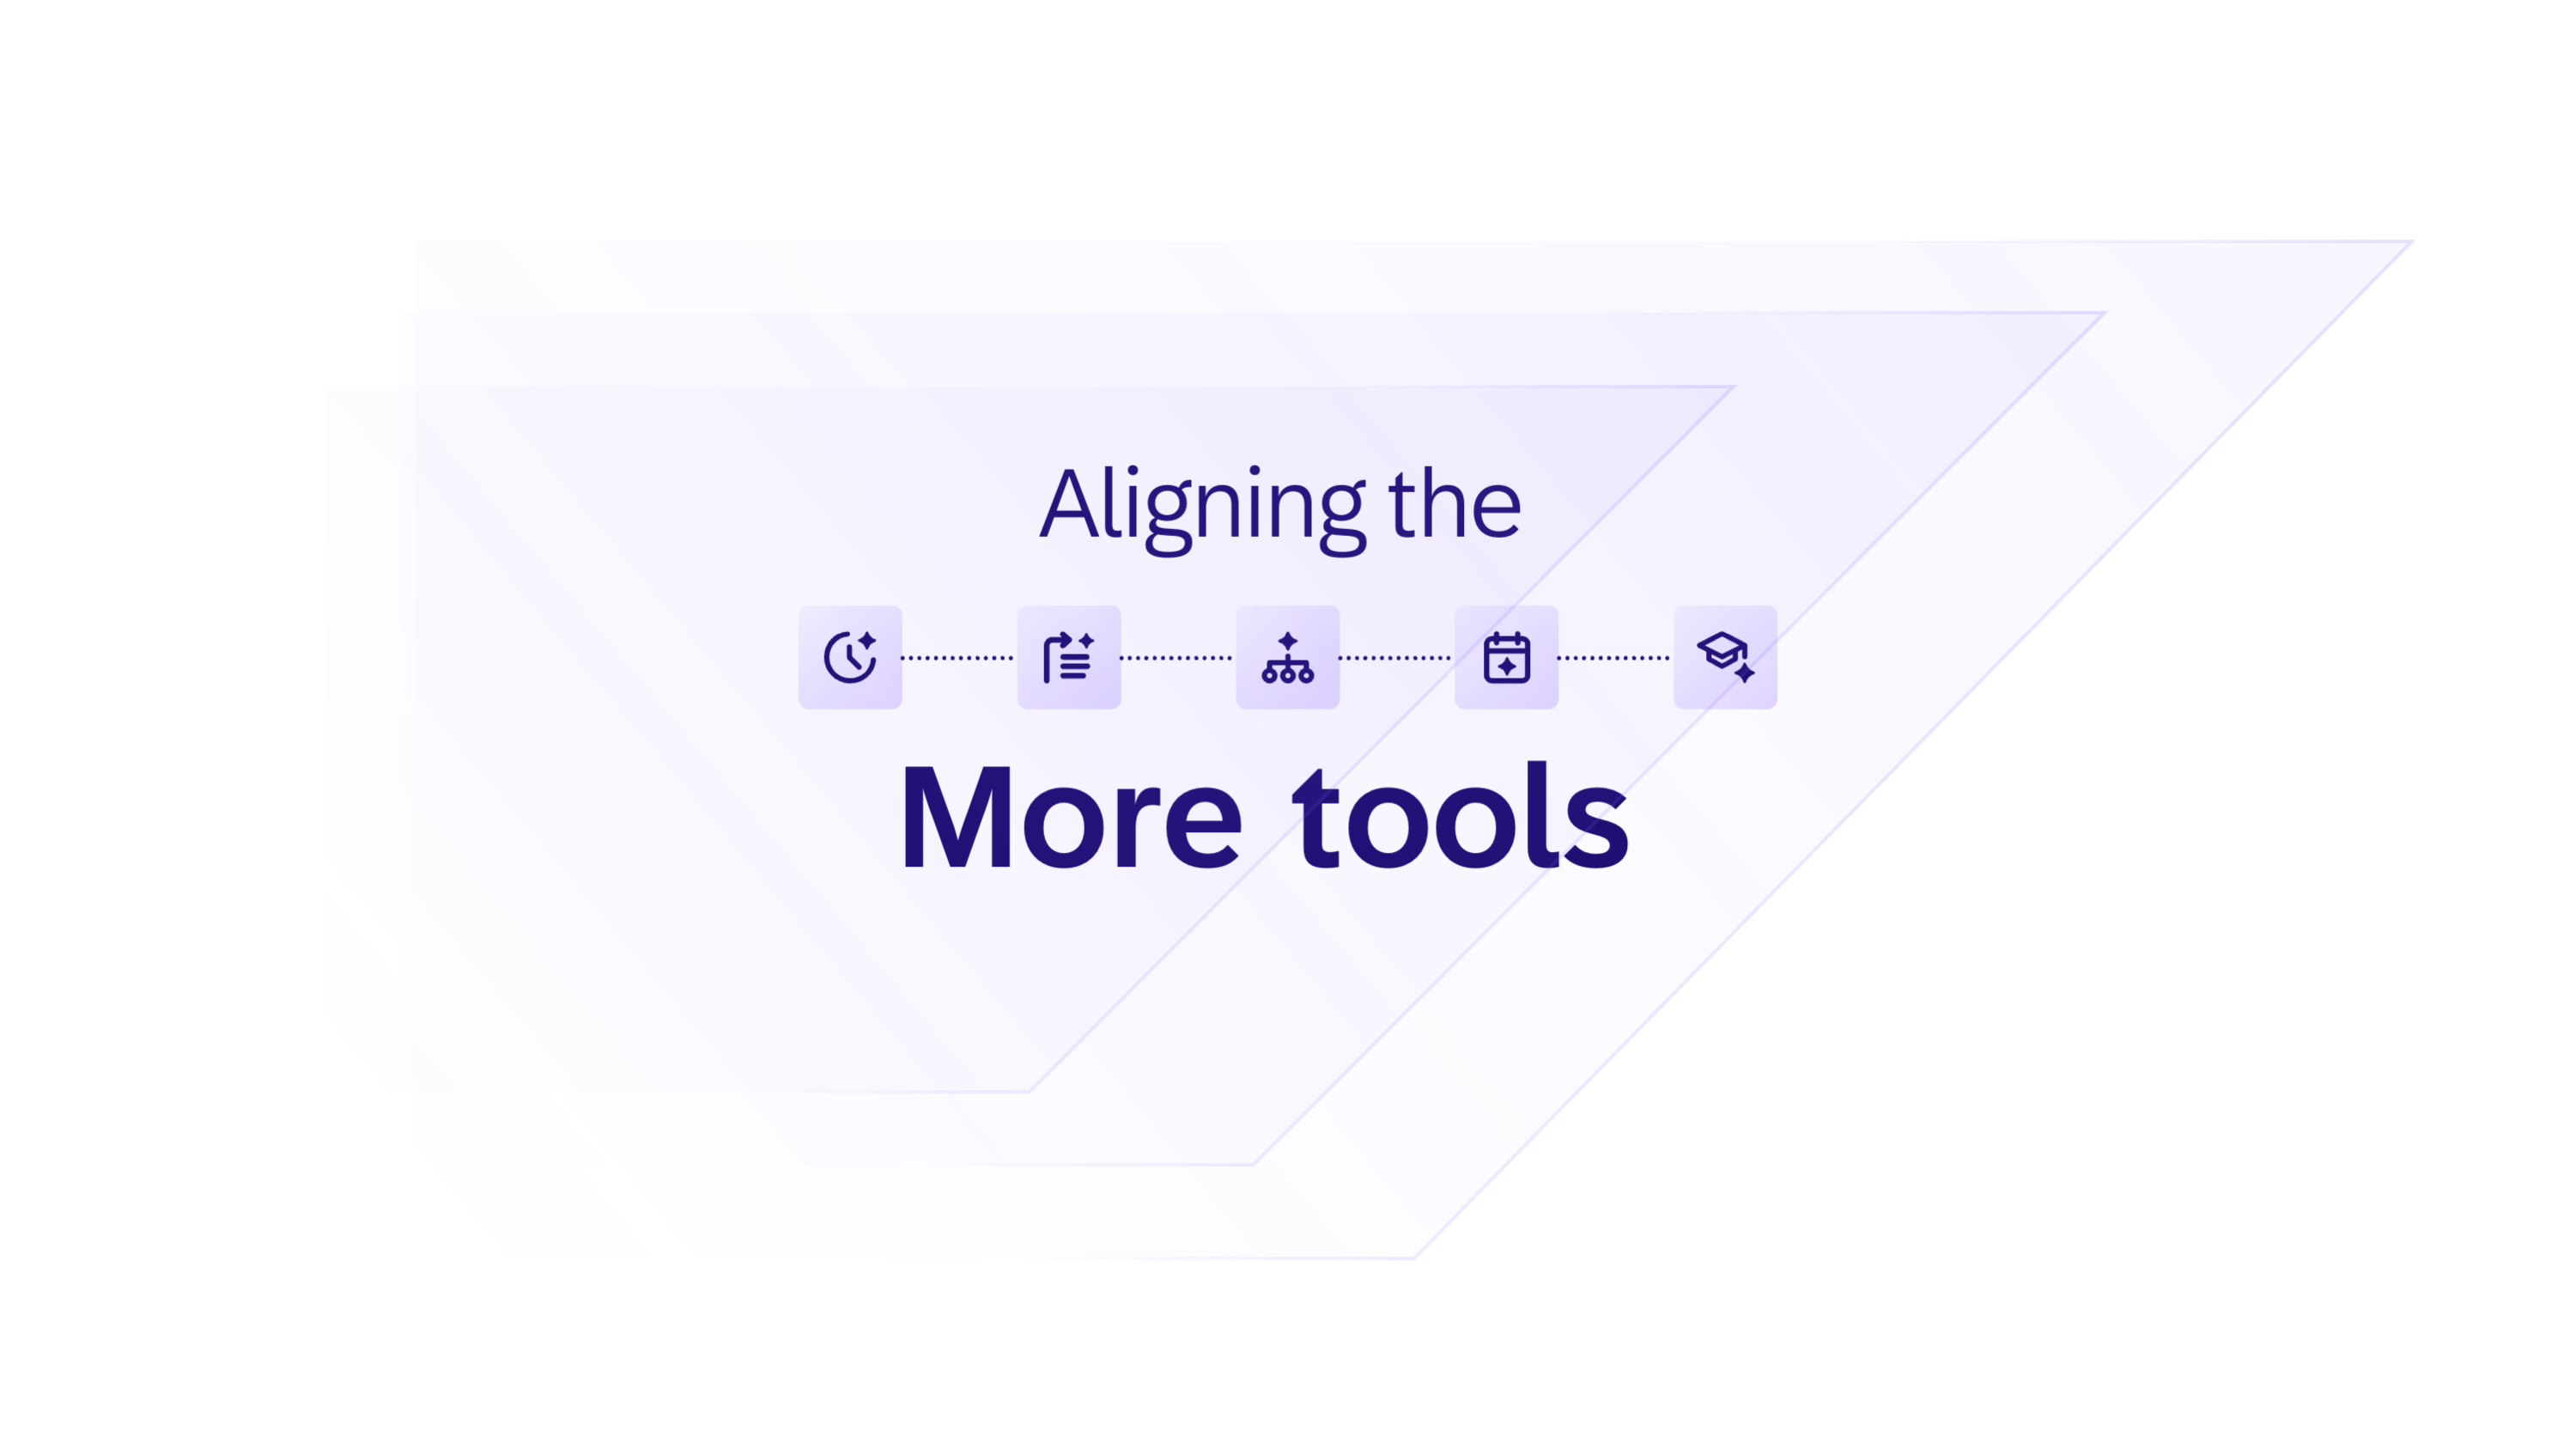
Numbers spin into focus, then scattered tool icons progressively appear — before gradually aligning as "More" rolls into "Right."
Rotate reveal · staggered fade-in · morph text swap
Morph Transition: Continuity Between Slides
Shared elements carry over — headline stays anchored while background shapes shift. Creates continuity without a hard cut.
PowerPoint Morph · matched element names · 500ms
Stat Counter: Number Roll
Numbers count up from 0 on entry. Deceleration easing — the number settles rather than snapping.
ease-out · 600–1200ms · integer steps only
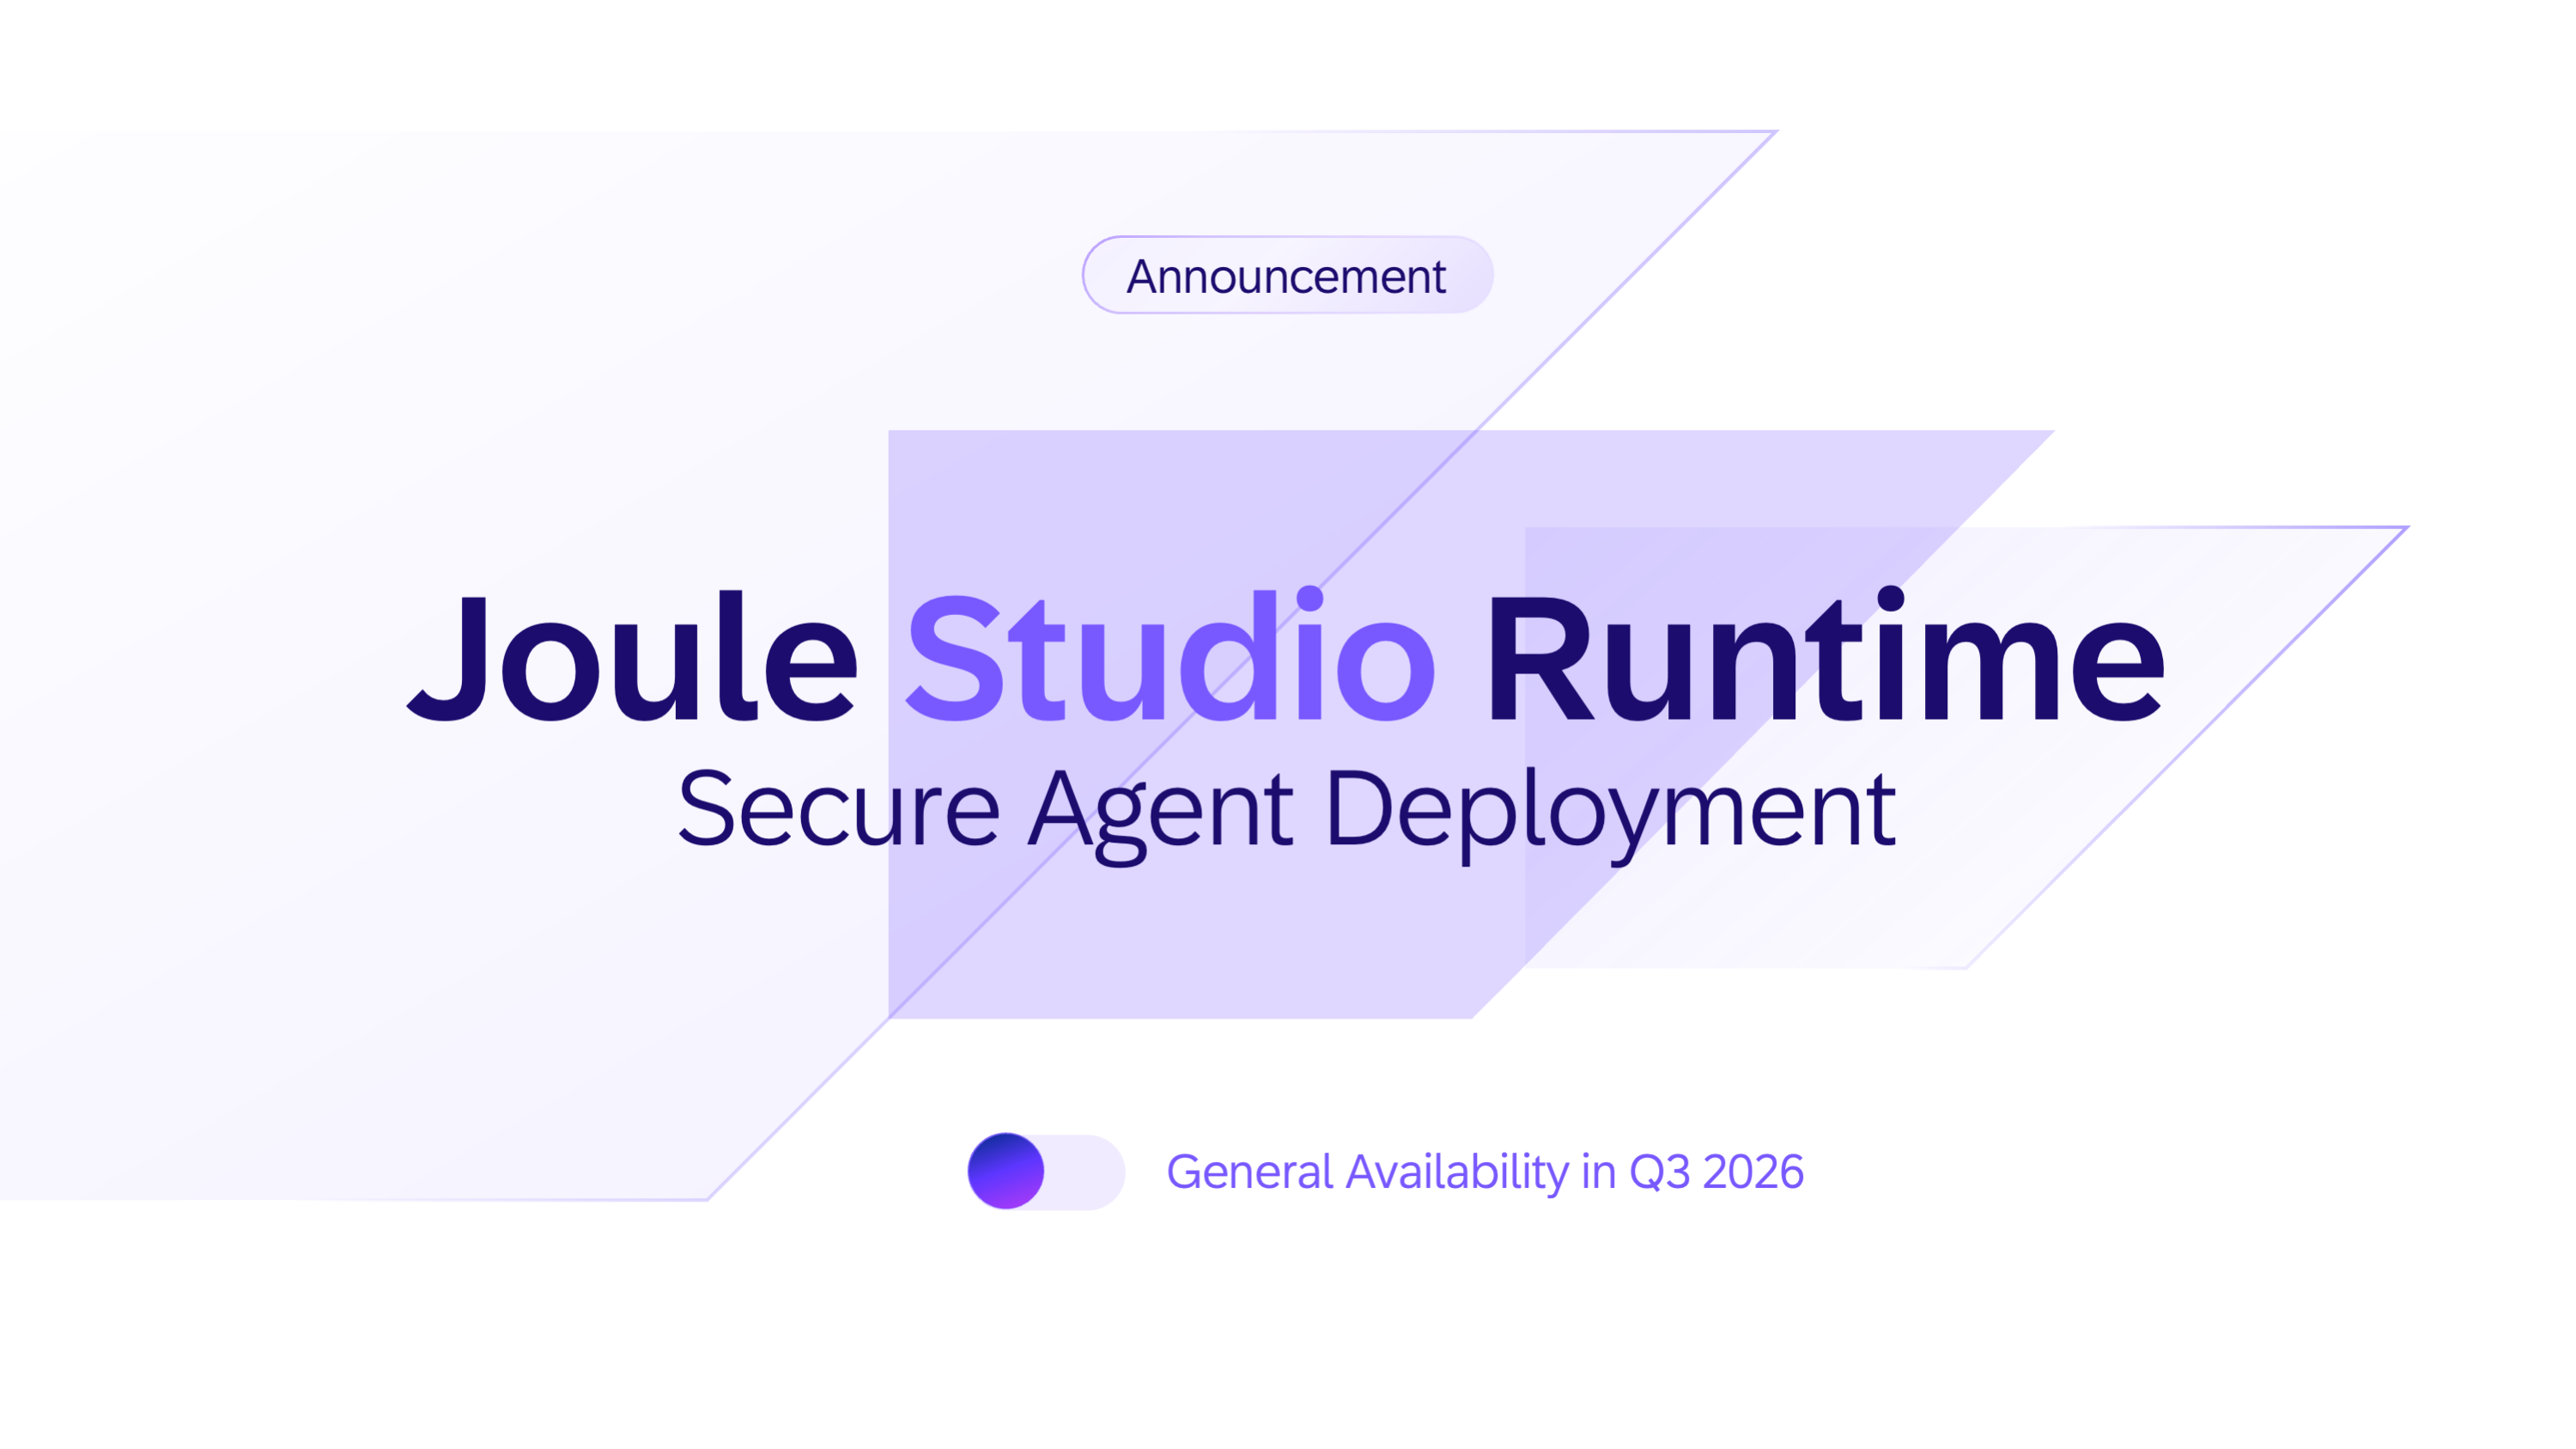
Announcement Reveal
Pill badge clips in with a left-edge mask wipe while the headline scales from 92%.
clip-path wipe 380ms + scale 0.92→1 · 280ms · delay 80ms
Diagram: Sequential Node Build
Diagrams build node-by-node on click. Connecting lines draw after both nodes land.
SVG stroke-dashoffset · 360ms per segment
Video: Click-to-Start
All demo videos require a presenter click. No auto-advance after video ends.
Manual trigger · no auto-advance · no loop
The "No Surprise Motion" Rule

Every animation is click-triggered. Motion serves the spoken word — it never races ahead of it.

Recurring Geometric Vocabulary
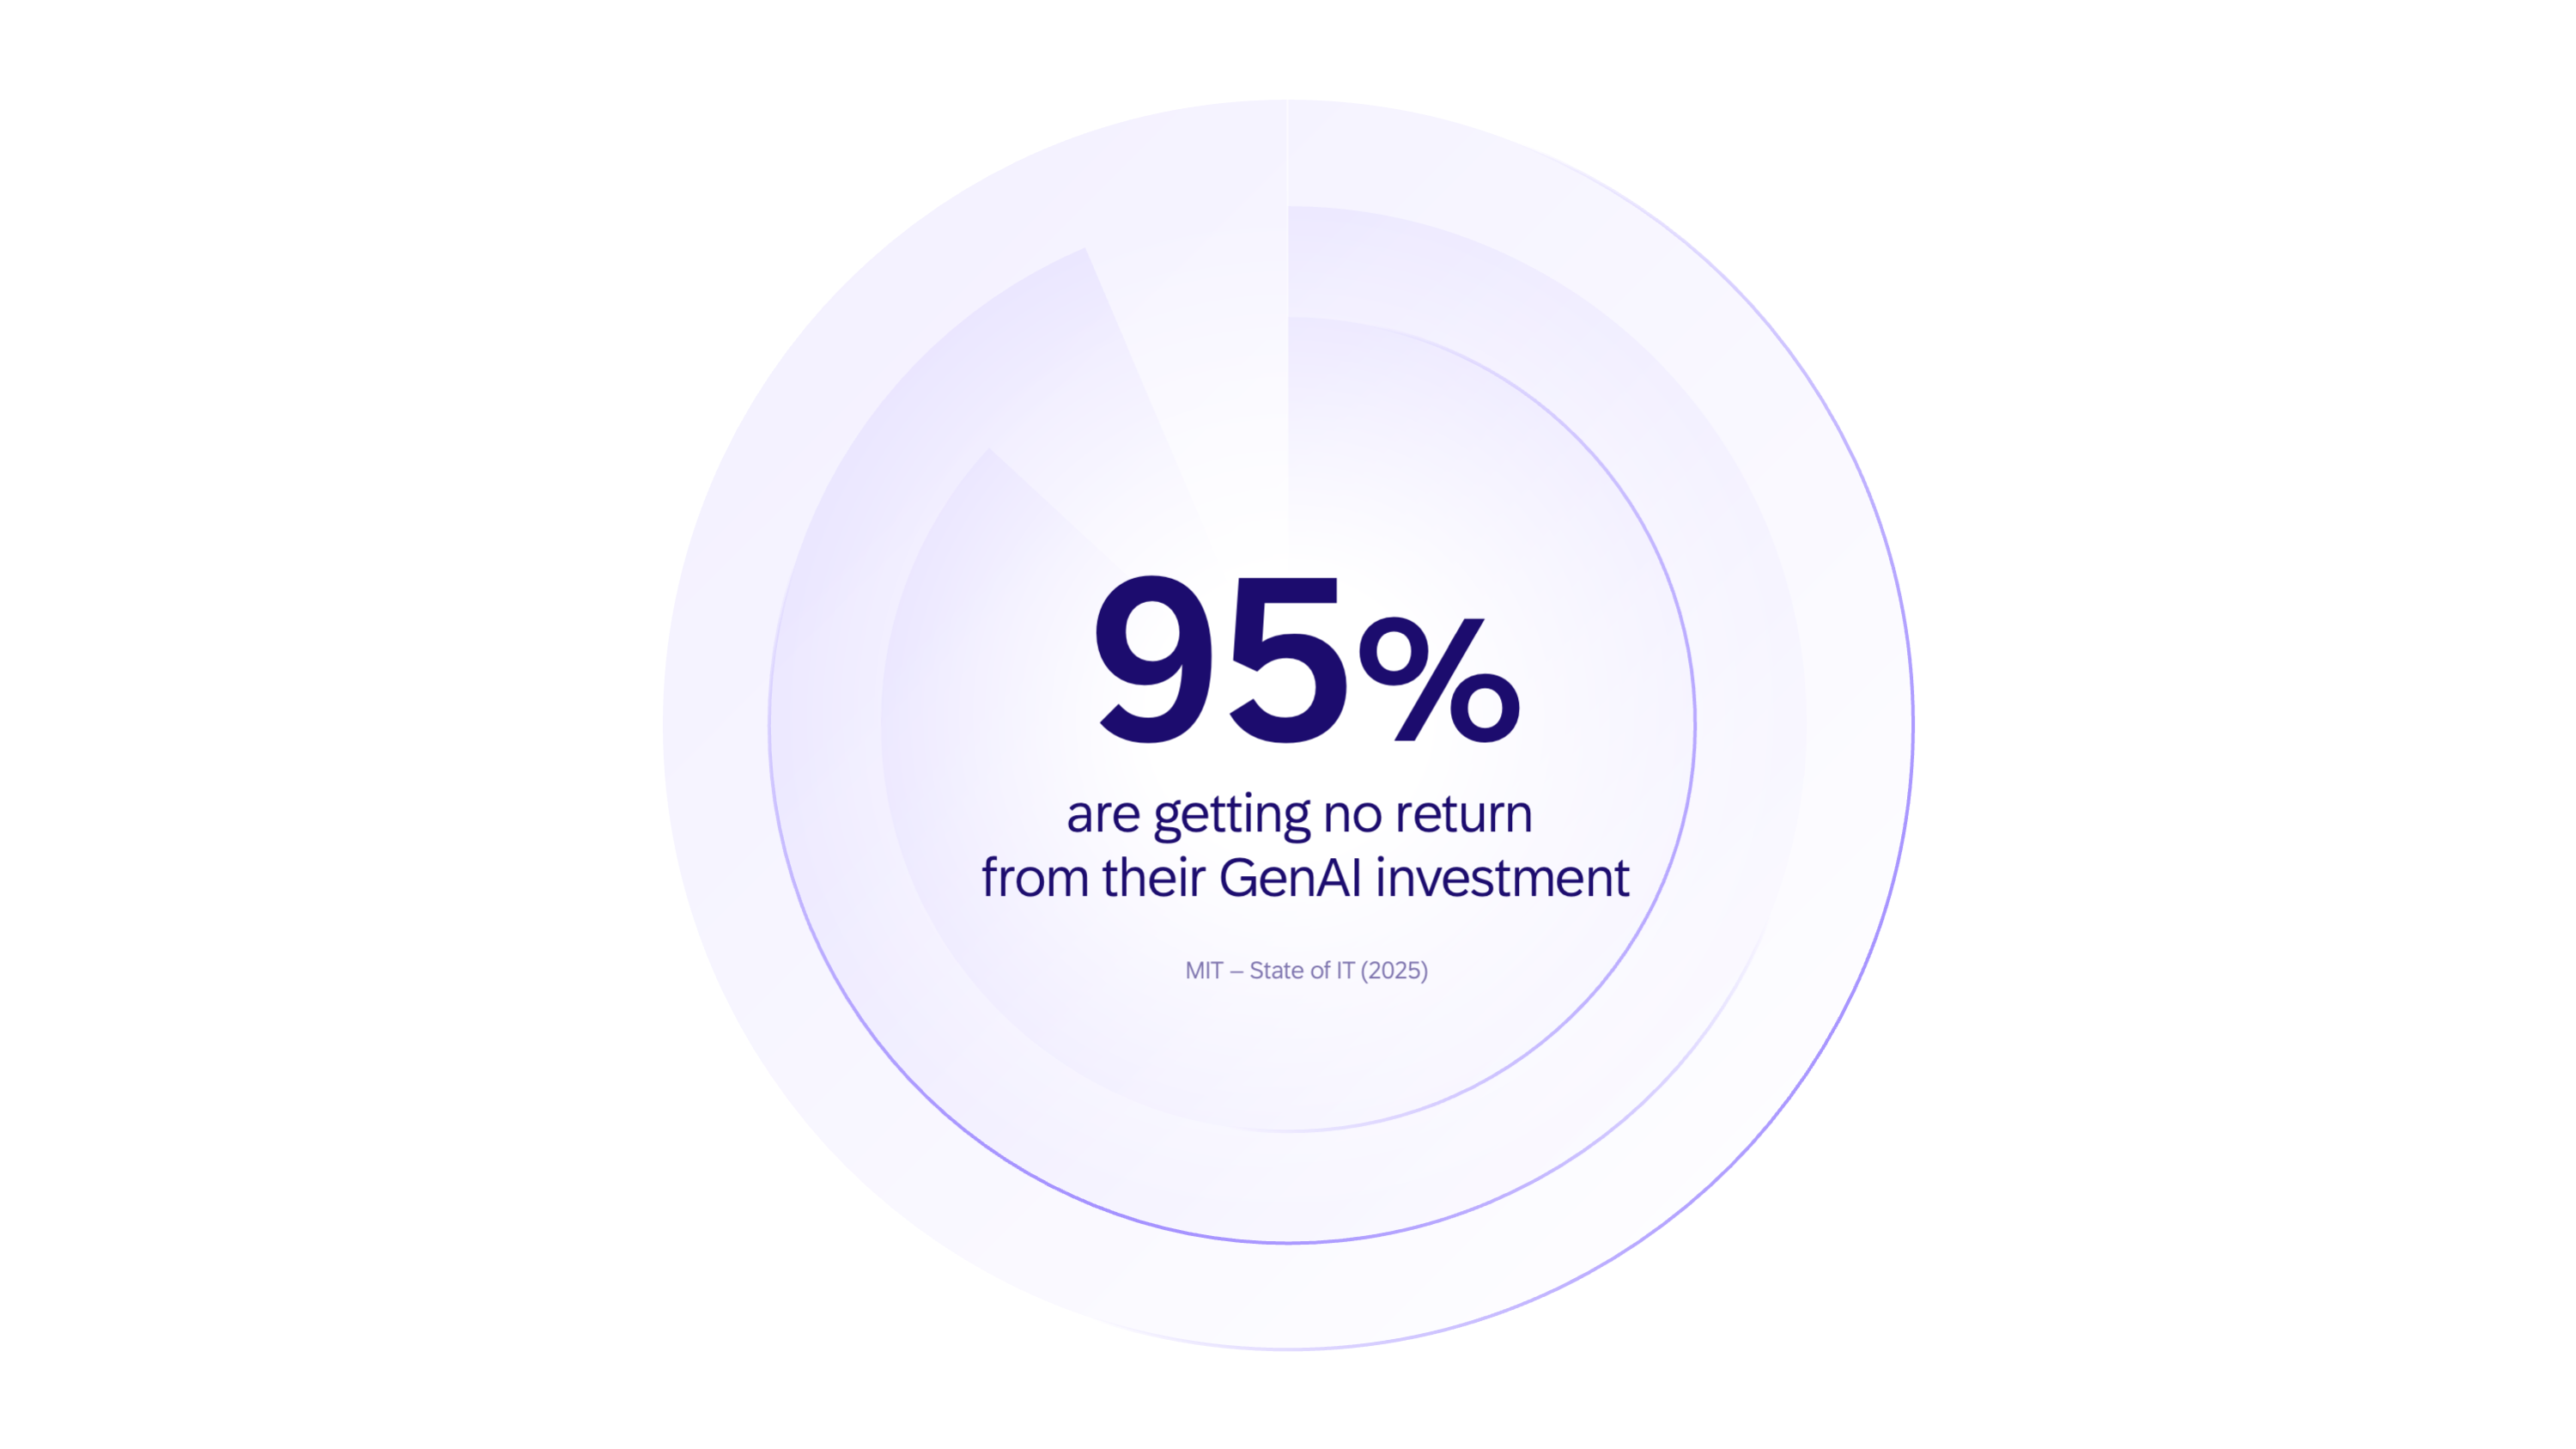
95%
Concentric Rings
Used on stat slides — the rings visually reinforce scale and draw the eye to the central number.
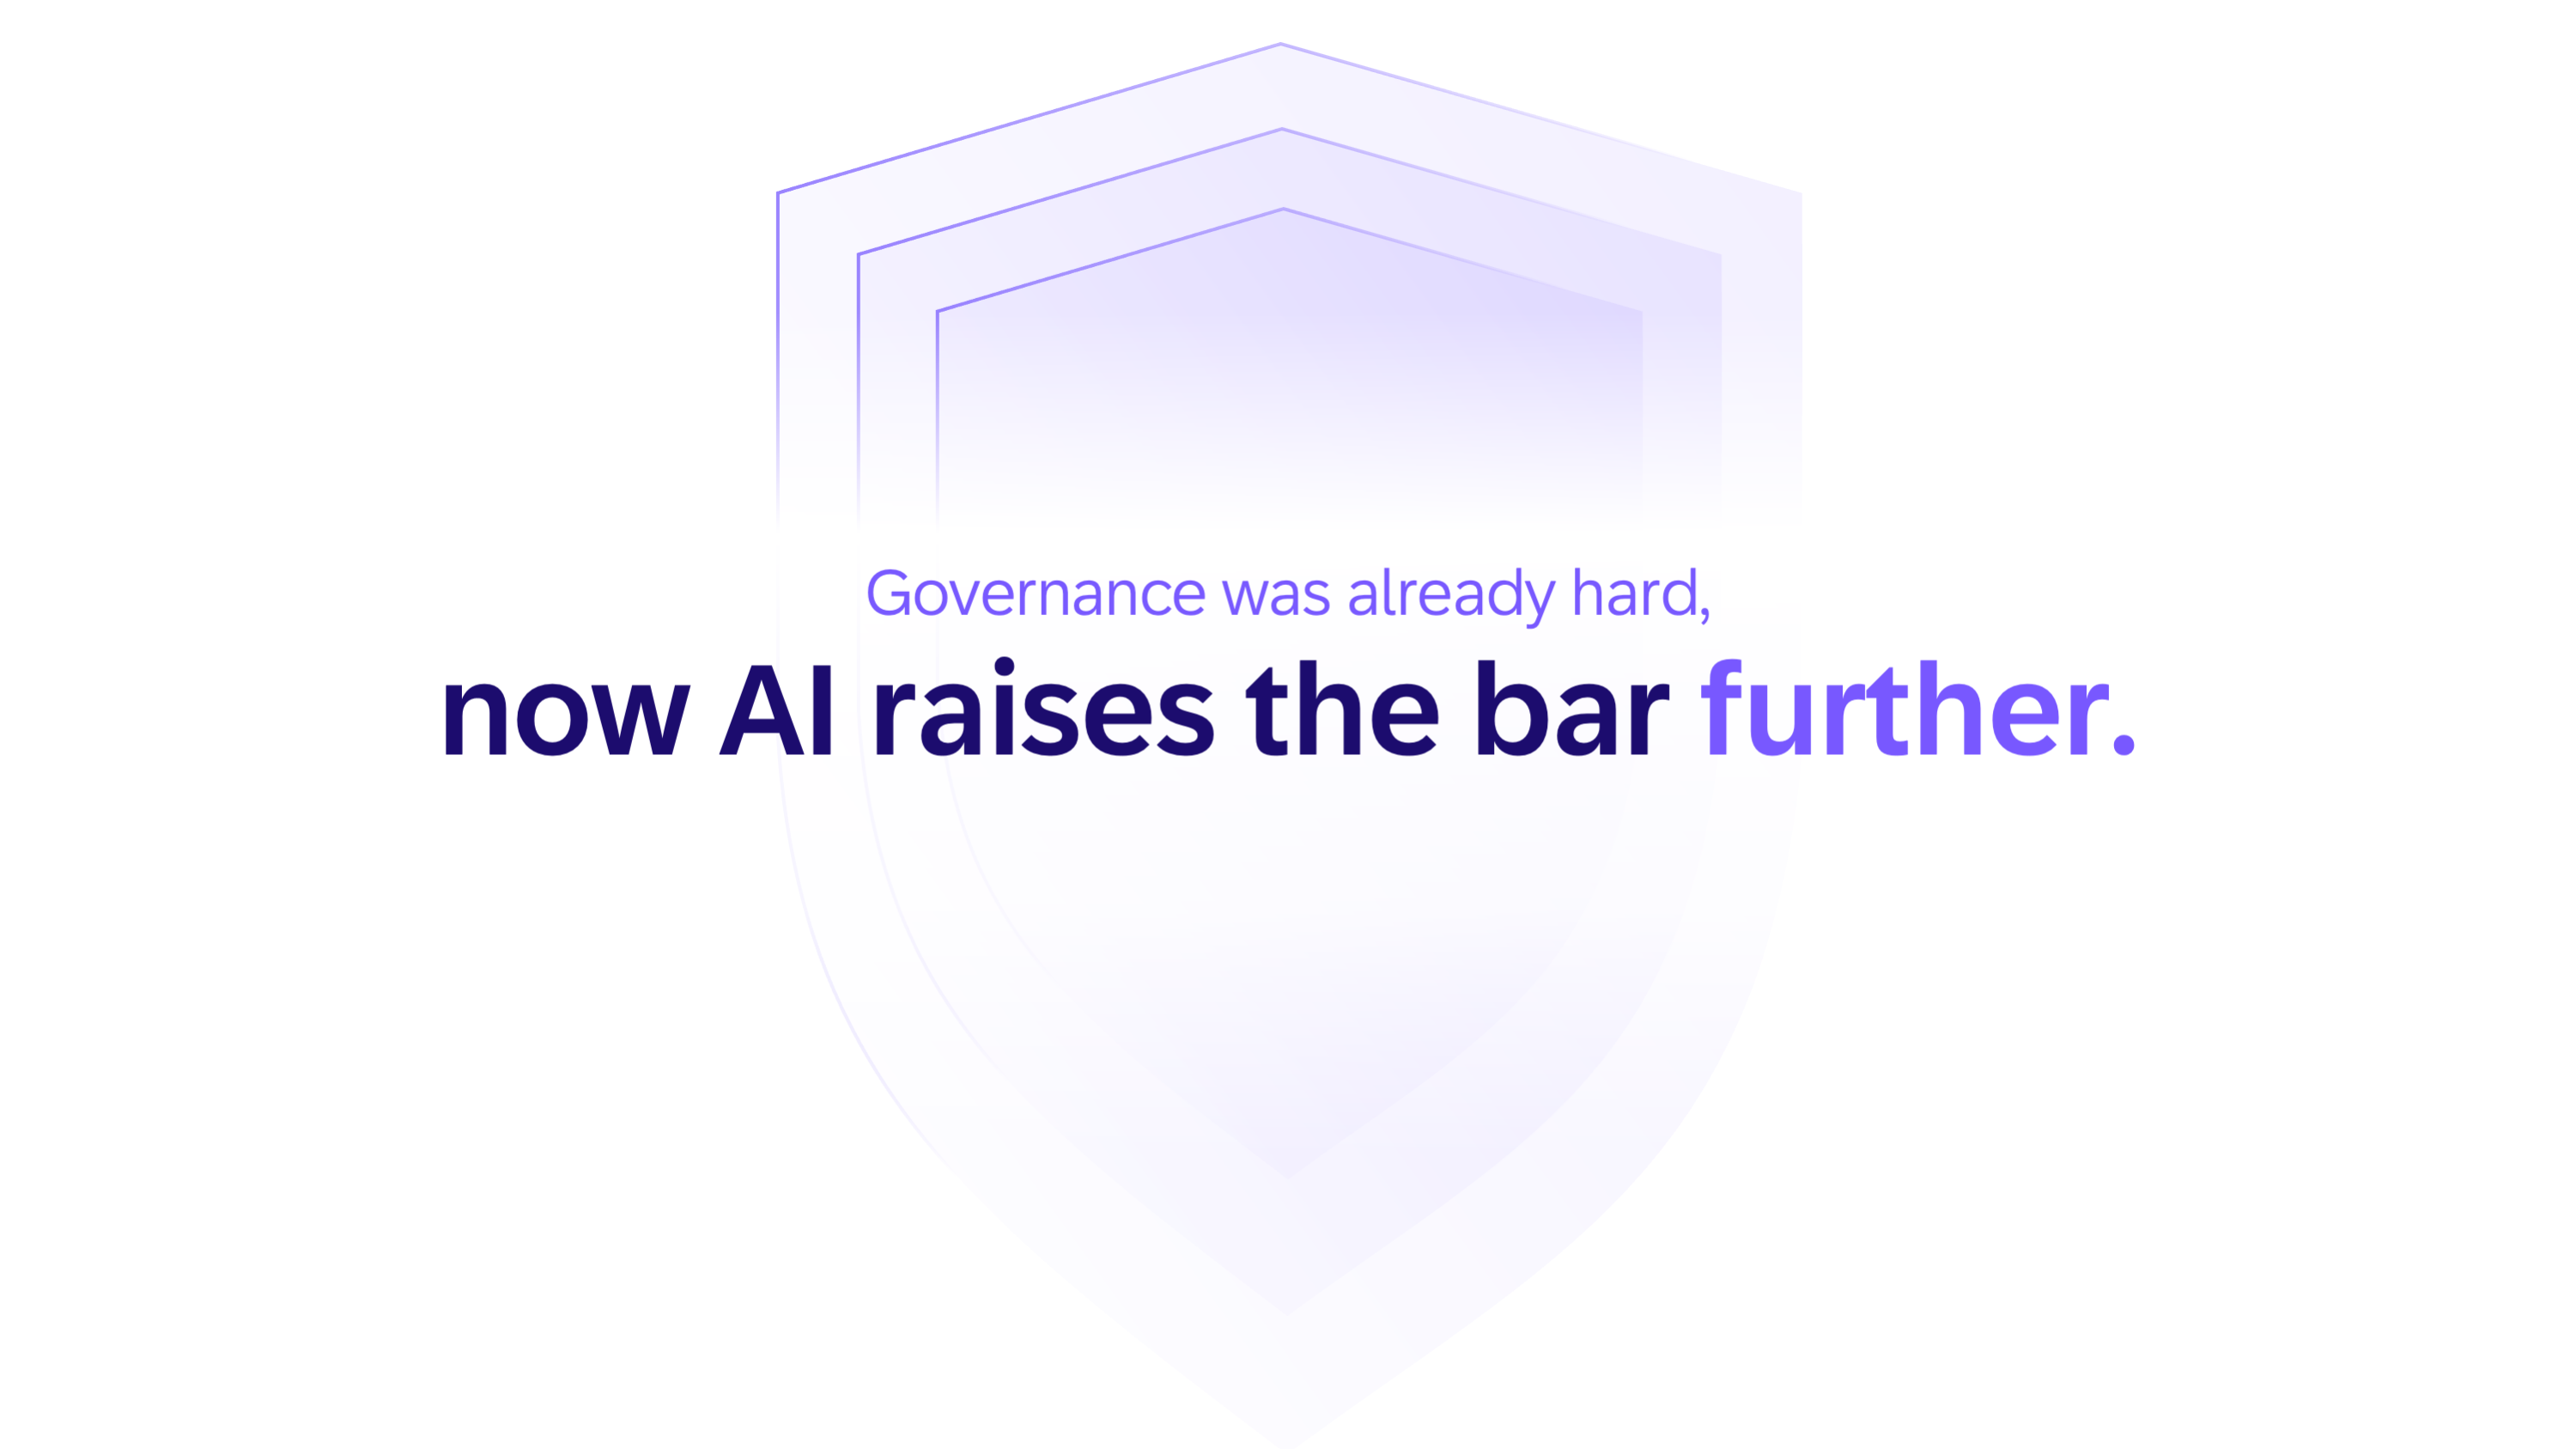
Concentric Shields
Governance & security slides. The shield depth visually reinforces layers of protection.
Stacked Parallelograms
Announcement & product reveal slides. Diagonal energy signals motion and forward momentum.
More tools
Floating Icon Cloud
Ecosystem & breadth slides. Scattered tiles at varying opacity convey abundance without listing.
Perspective Dot Grid
Feature/flow slides. Receding grid implies depth and "platform beneath everything" framing.
Soft Blob Accents
Data & ROI slides. Organic shapes in corners add warmth; they balance hard numbers on screen.
Hexagon Frame
CTA & closing slides. Hexagon connotes structure and connectivity — a call to "come build inside this."
OFF · beforeON · after
Toggle Indicator
Before/after comparison slides. Instantly communicates binary state change without words.
Primary Palette — Lavender-First

SAP's brand is blue, but this AI-focused keynote shifts toward a lavender-purple palette to signal the AI theme — while retaining blue as a supporting accent. White canvas keeps the presentation confident and clean at venue scale.

Canvas
#FFFFFF
Slide background
Lavender
#EDEDFA
Shape fill / tint
Deep Indigo
#1C1A5E
Headlines / body
Soft Violet
#7B6FCE
Accent word / badge
Lilac
#9B90C8
Secondary text
Indigo
#4A3FA0
Icon / toggle active
SAP Blue
#6A9FEE
Icon background tile
Single Accent Discipline

Soft violet (#7B6FCE) is used exclusively for the one "power word" per headline. Overuse breaks the signal.

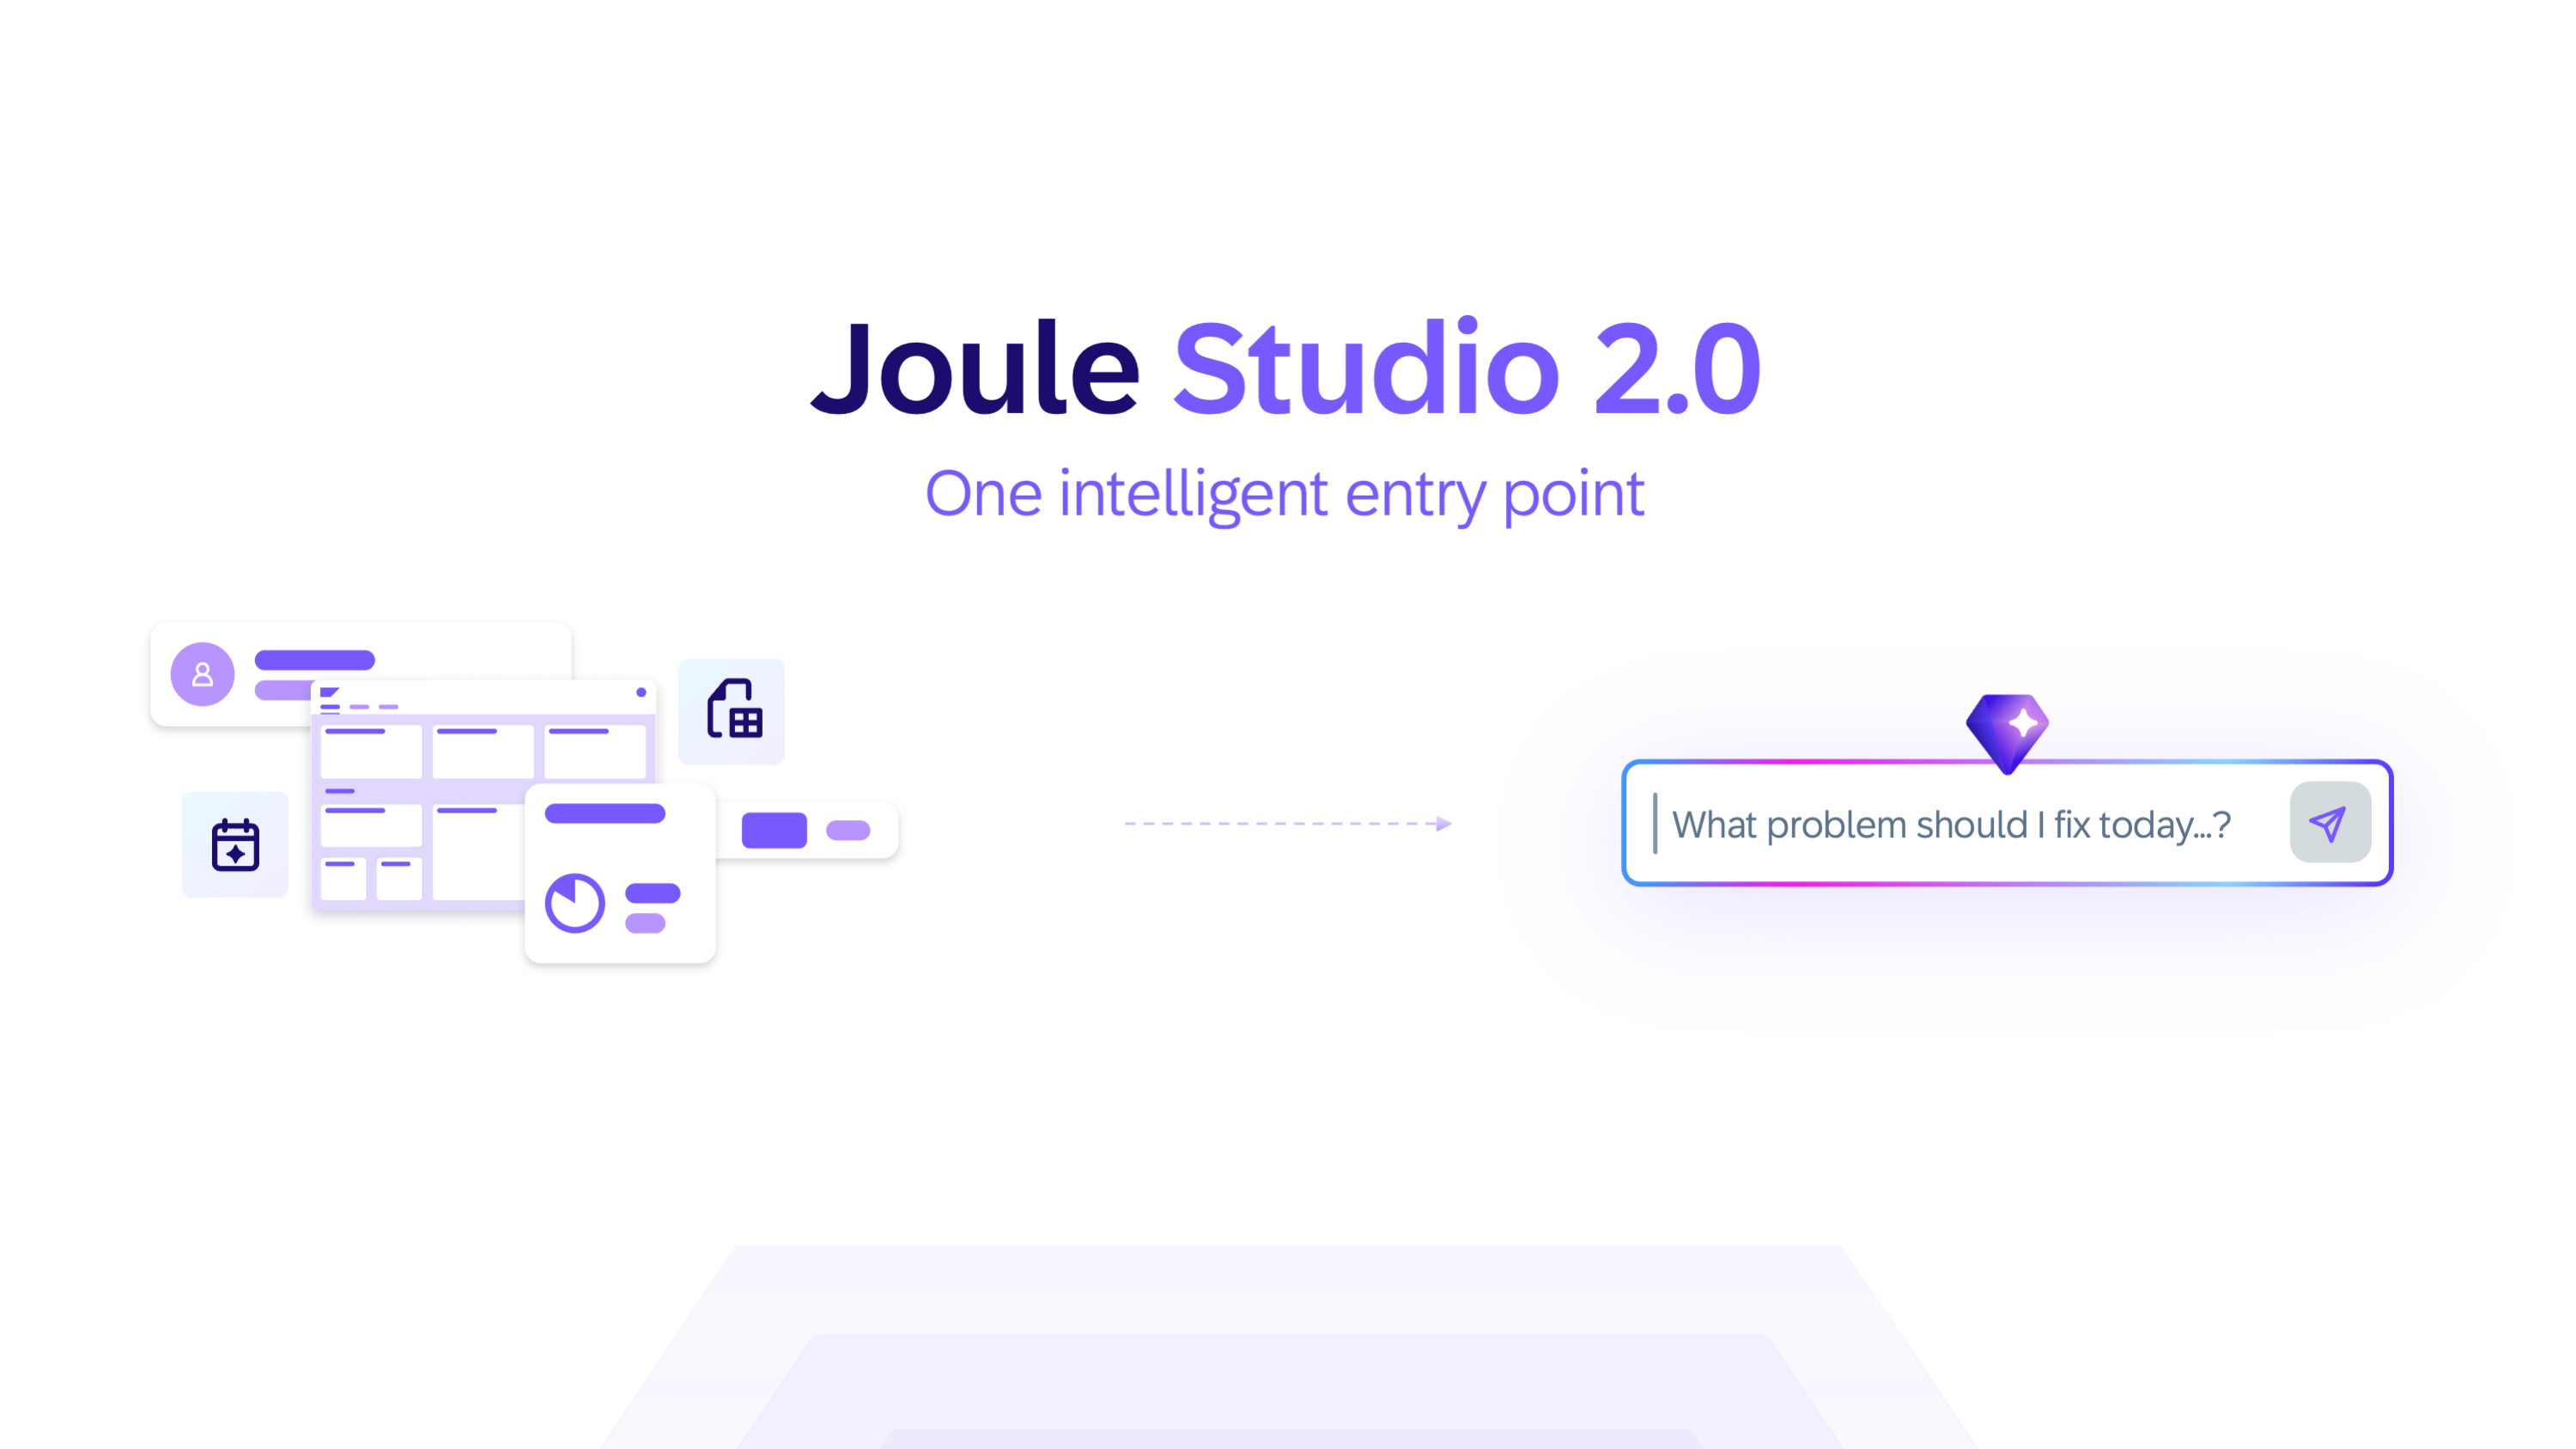
Joule Studio 2.0
live example · headline colour split
Type Scale — SAP 72, Optimised for 15m Viewing Distance
Hero Headline
Weight 800
now AI raises the bar further.
50–72px / −0.03em
SAP 72 ExtraBold
Product Title
Weight 800 + 700
Joule Studio 2.0
36–48px / split weight
ink + violet
Stat Number
Weight 900
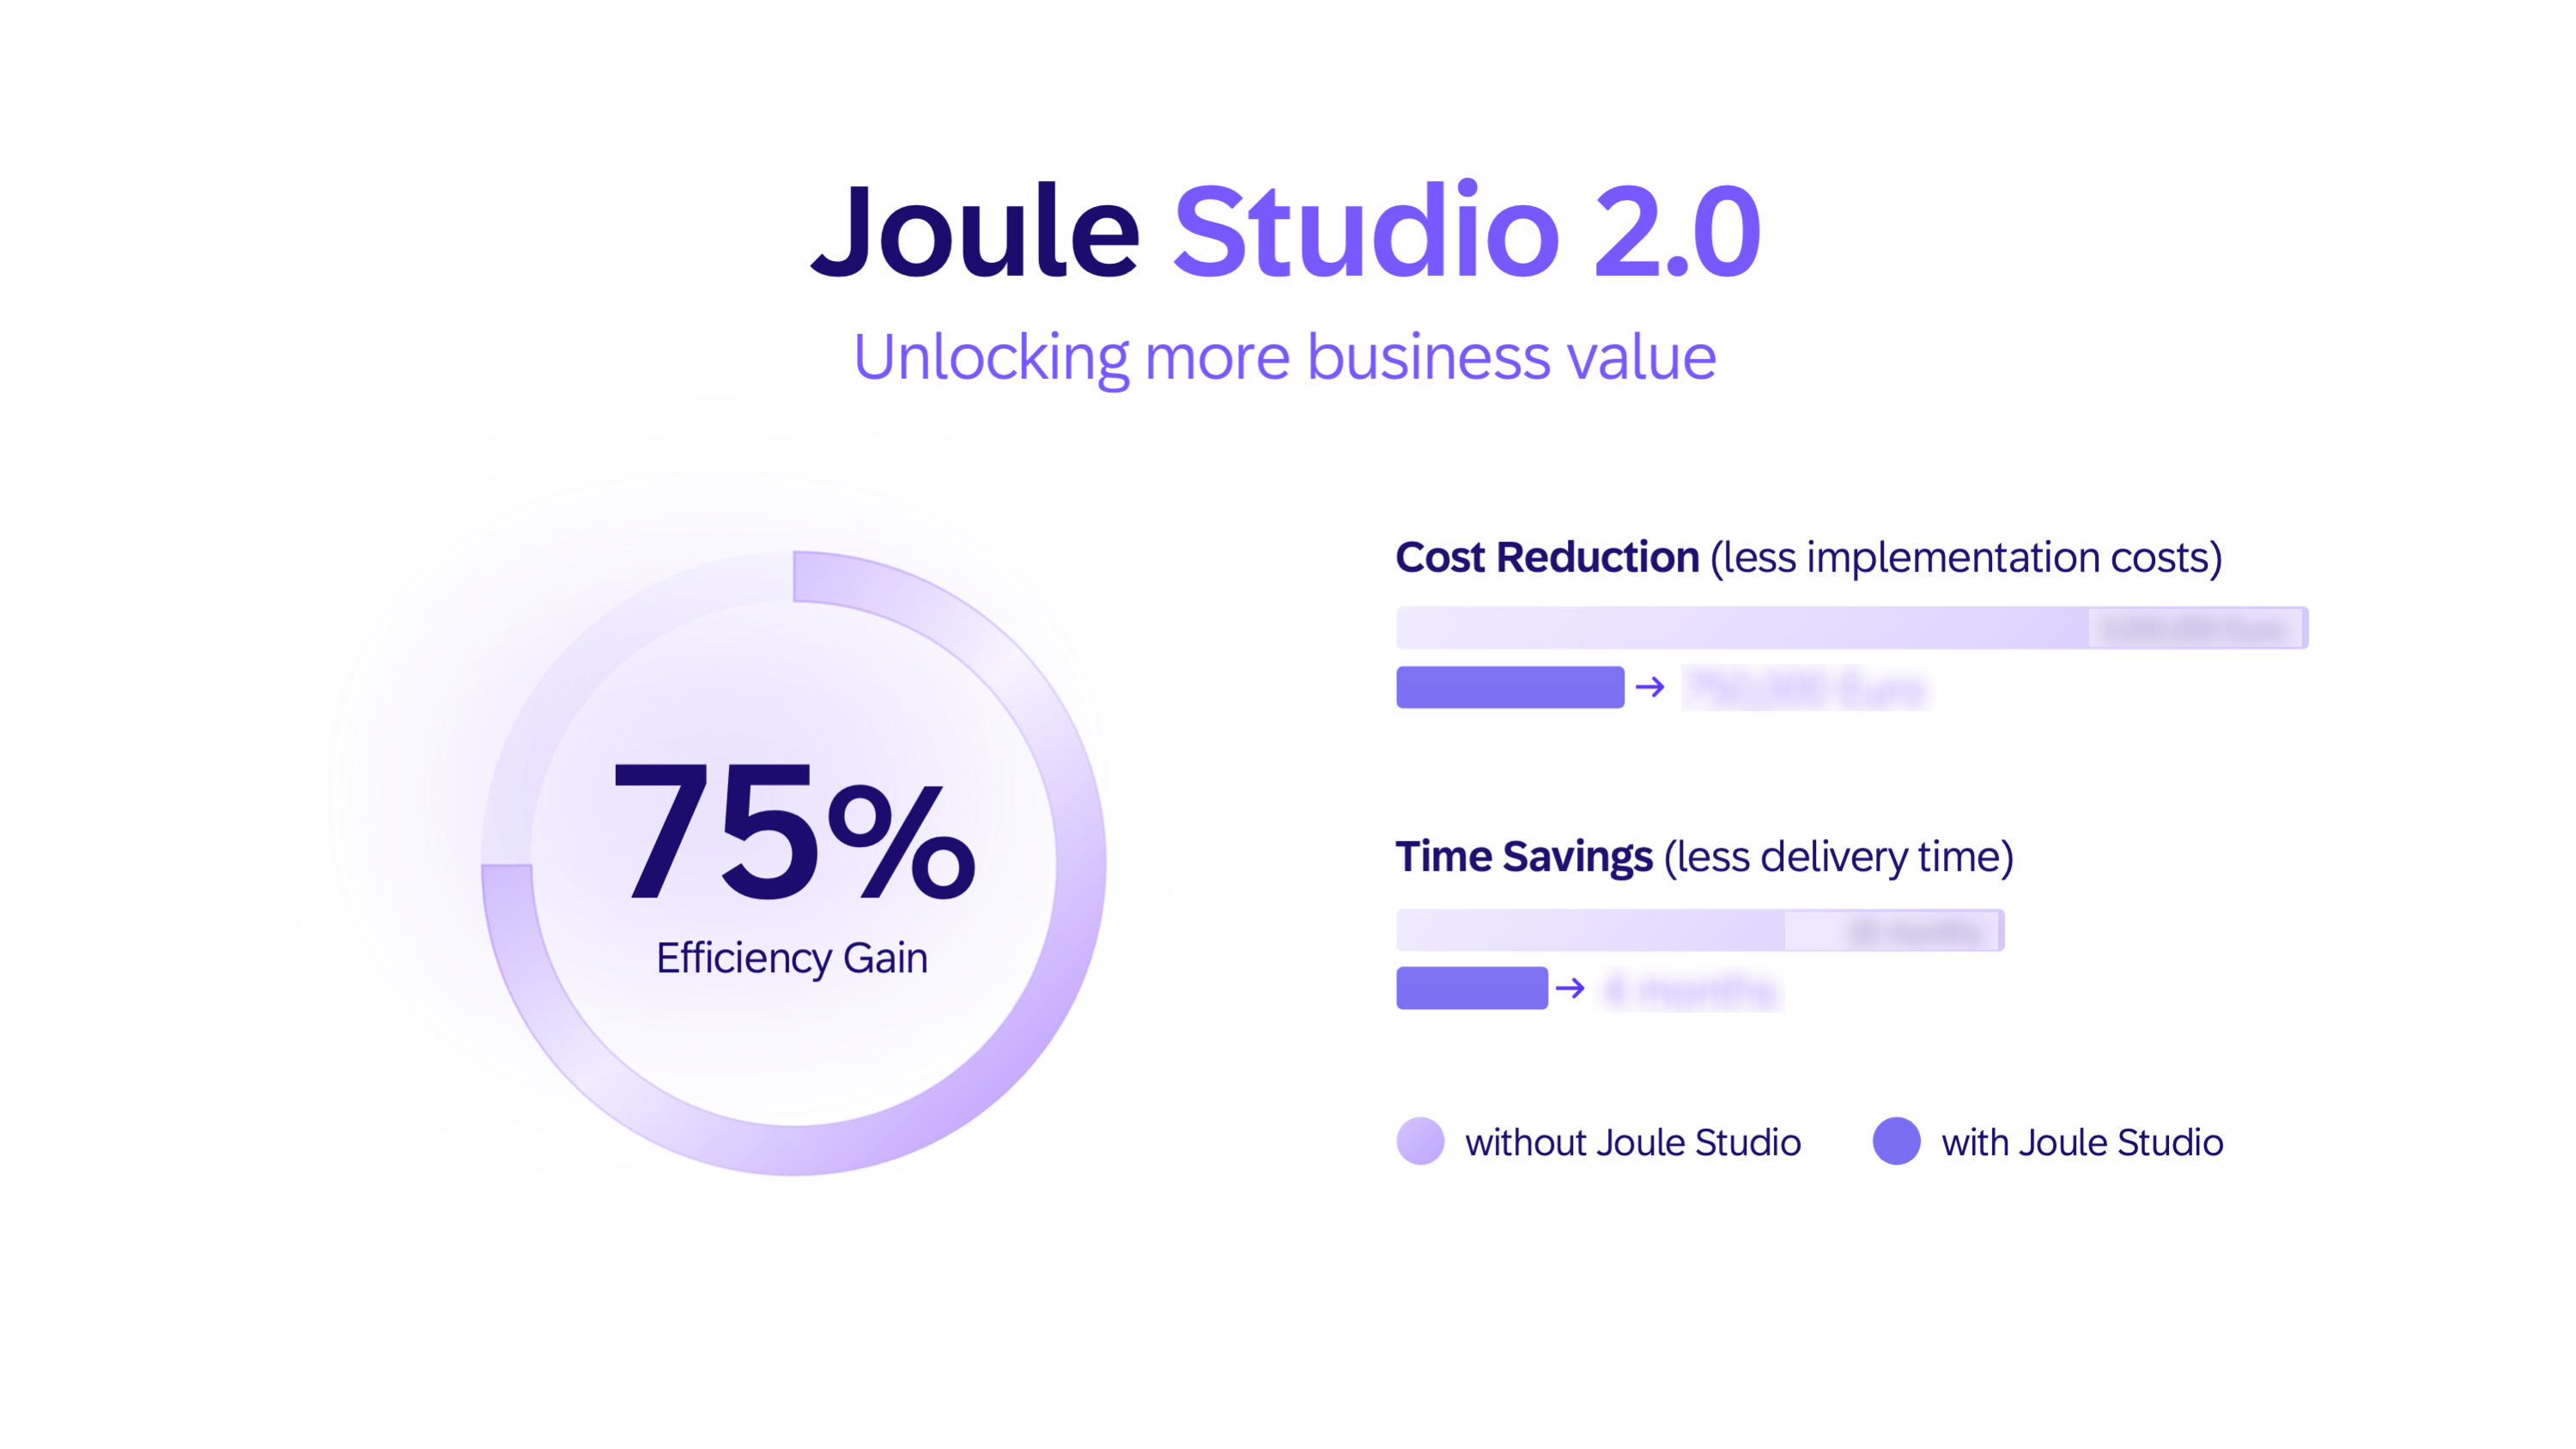
75%
72–120px / −0.05em
white, no gradient
Subtitle / Tagline
Weight 400
One intelligent entry point
20–24px / violet
below headline only
Announcement Label
Capsule badge
Announcement
14px · rounded pill
minimal, not amber
GA Date Label
Toggle + text
General Availability in Q3 2026
14px violet · toggle icon
GA date pattern
Typeface

SAP 72 is SAP's proprietary typeface, built for screen legibility and multilingual support across all enterprise contexts.

Weight Contrast Rule

Every headline uses a weight split — product name in ExtraBold (800), descriptor in violet Bold (700). Rhythm without changing size.

Full Bleed Statement
One idea, max 12 words. Motif fills the background.
20%
100K
57K
Stat Triptych
3 KPIs side by side. Numbers ARE the visual.
75%
Efficiency Gain
Hero Metric
Single oversized number. Donut left, before/after bars right.
Left Visual + Right Copy
55/45 split. Visual grounds the abstract; copy defines it.
Intent →
Process →
Linear Flow Diagram
Pill-nodes on dashed lines. Animates node by node on click.
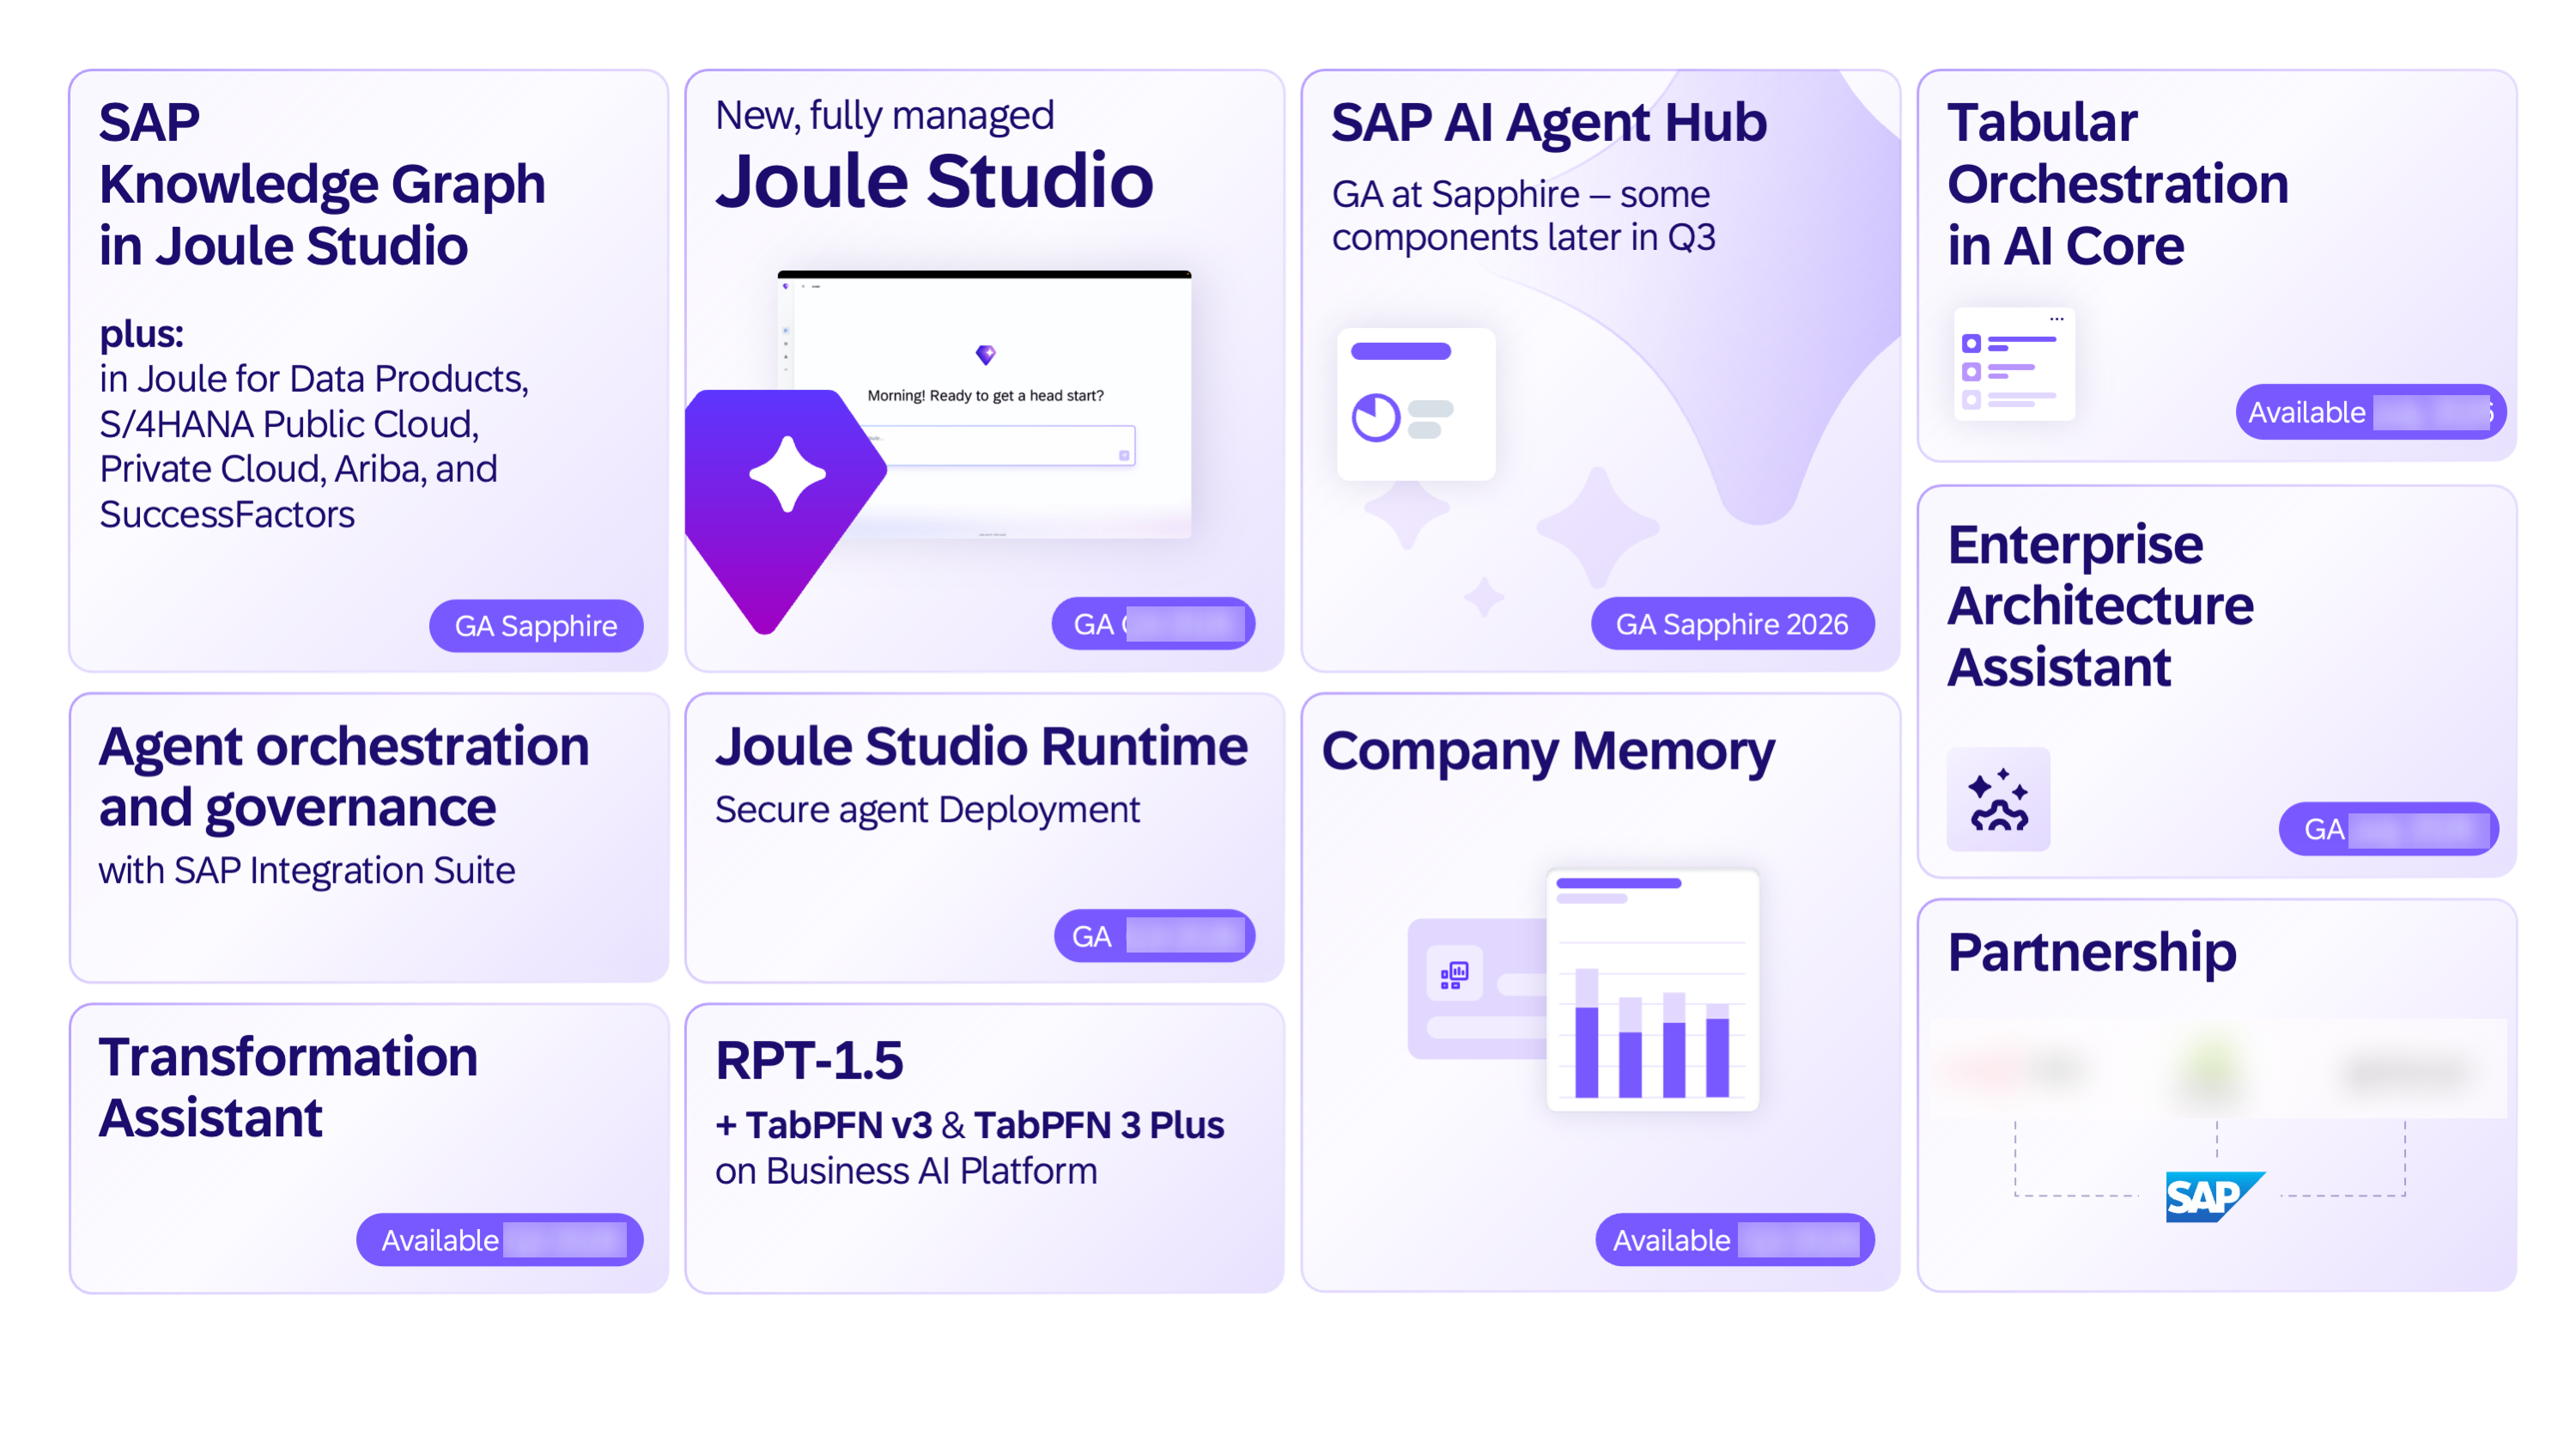
Announcement Grid
2×4 card grid. Product name + GA badge per card.
83
slides across 4 speakers, one unified visual grammar
20K+
attendees across Orlando and Madrid editions
1 hr
runtime — every second of attention budgeted intentionally
Host
Michael Ameling
CPO, Business Technology Platform · SAP SE
AI Strategy
Jonathan von Rueden
Chief AI Officer · SAP SE
Partner Voice
André Christ
Co-Founder & GM, SAP LeanIX · SAP SE
External Voice
Jan Oberhauser
Founder & CEO · n8n GmbH
The Core Challenge

One keynote. Four speakers. Three jobs: announcements, proof, and a boardroom-ready narrative.
Multi-speakerLive demosAnnouncement cadenceCustomer stories
Design North Star

"Turn enterprise AI complexity into a decision a CIO can make on Monday morning."

Design principle guiding every layout and transition decision
Act I
The Pain
95% get no ROI from GenAI. Governance is already hard.
Slides 3–8
Act II
The Vision
SAP Business AI Platform as command center. Autonomous Enterprise introduced.
Slides 9–12
Act III
The Proof
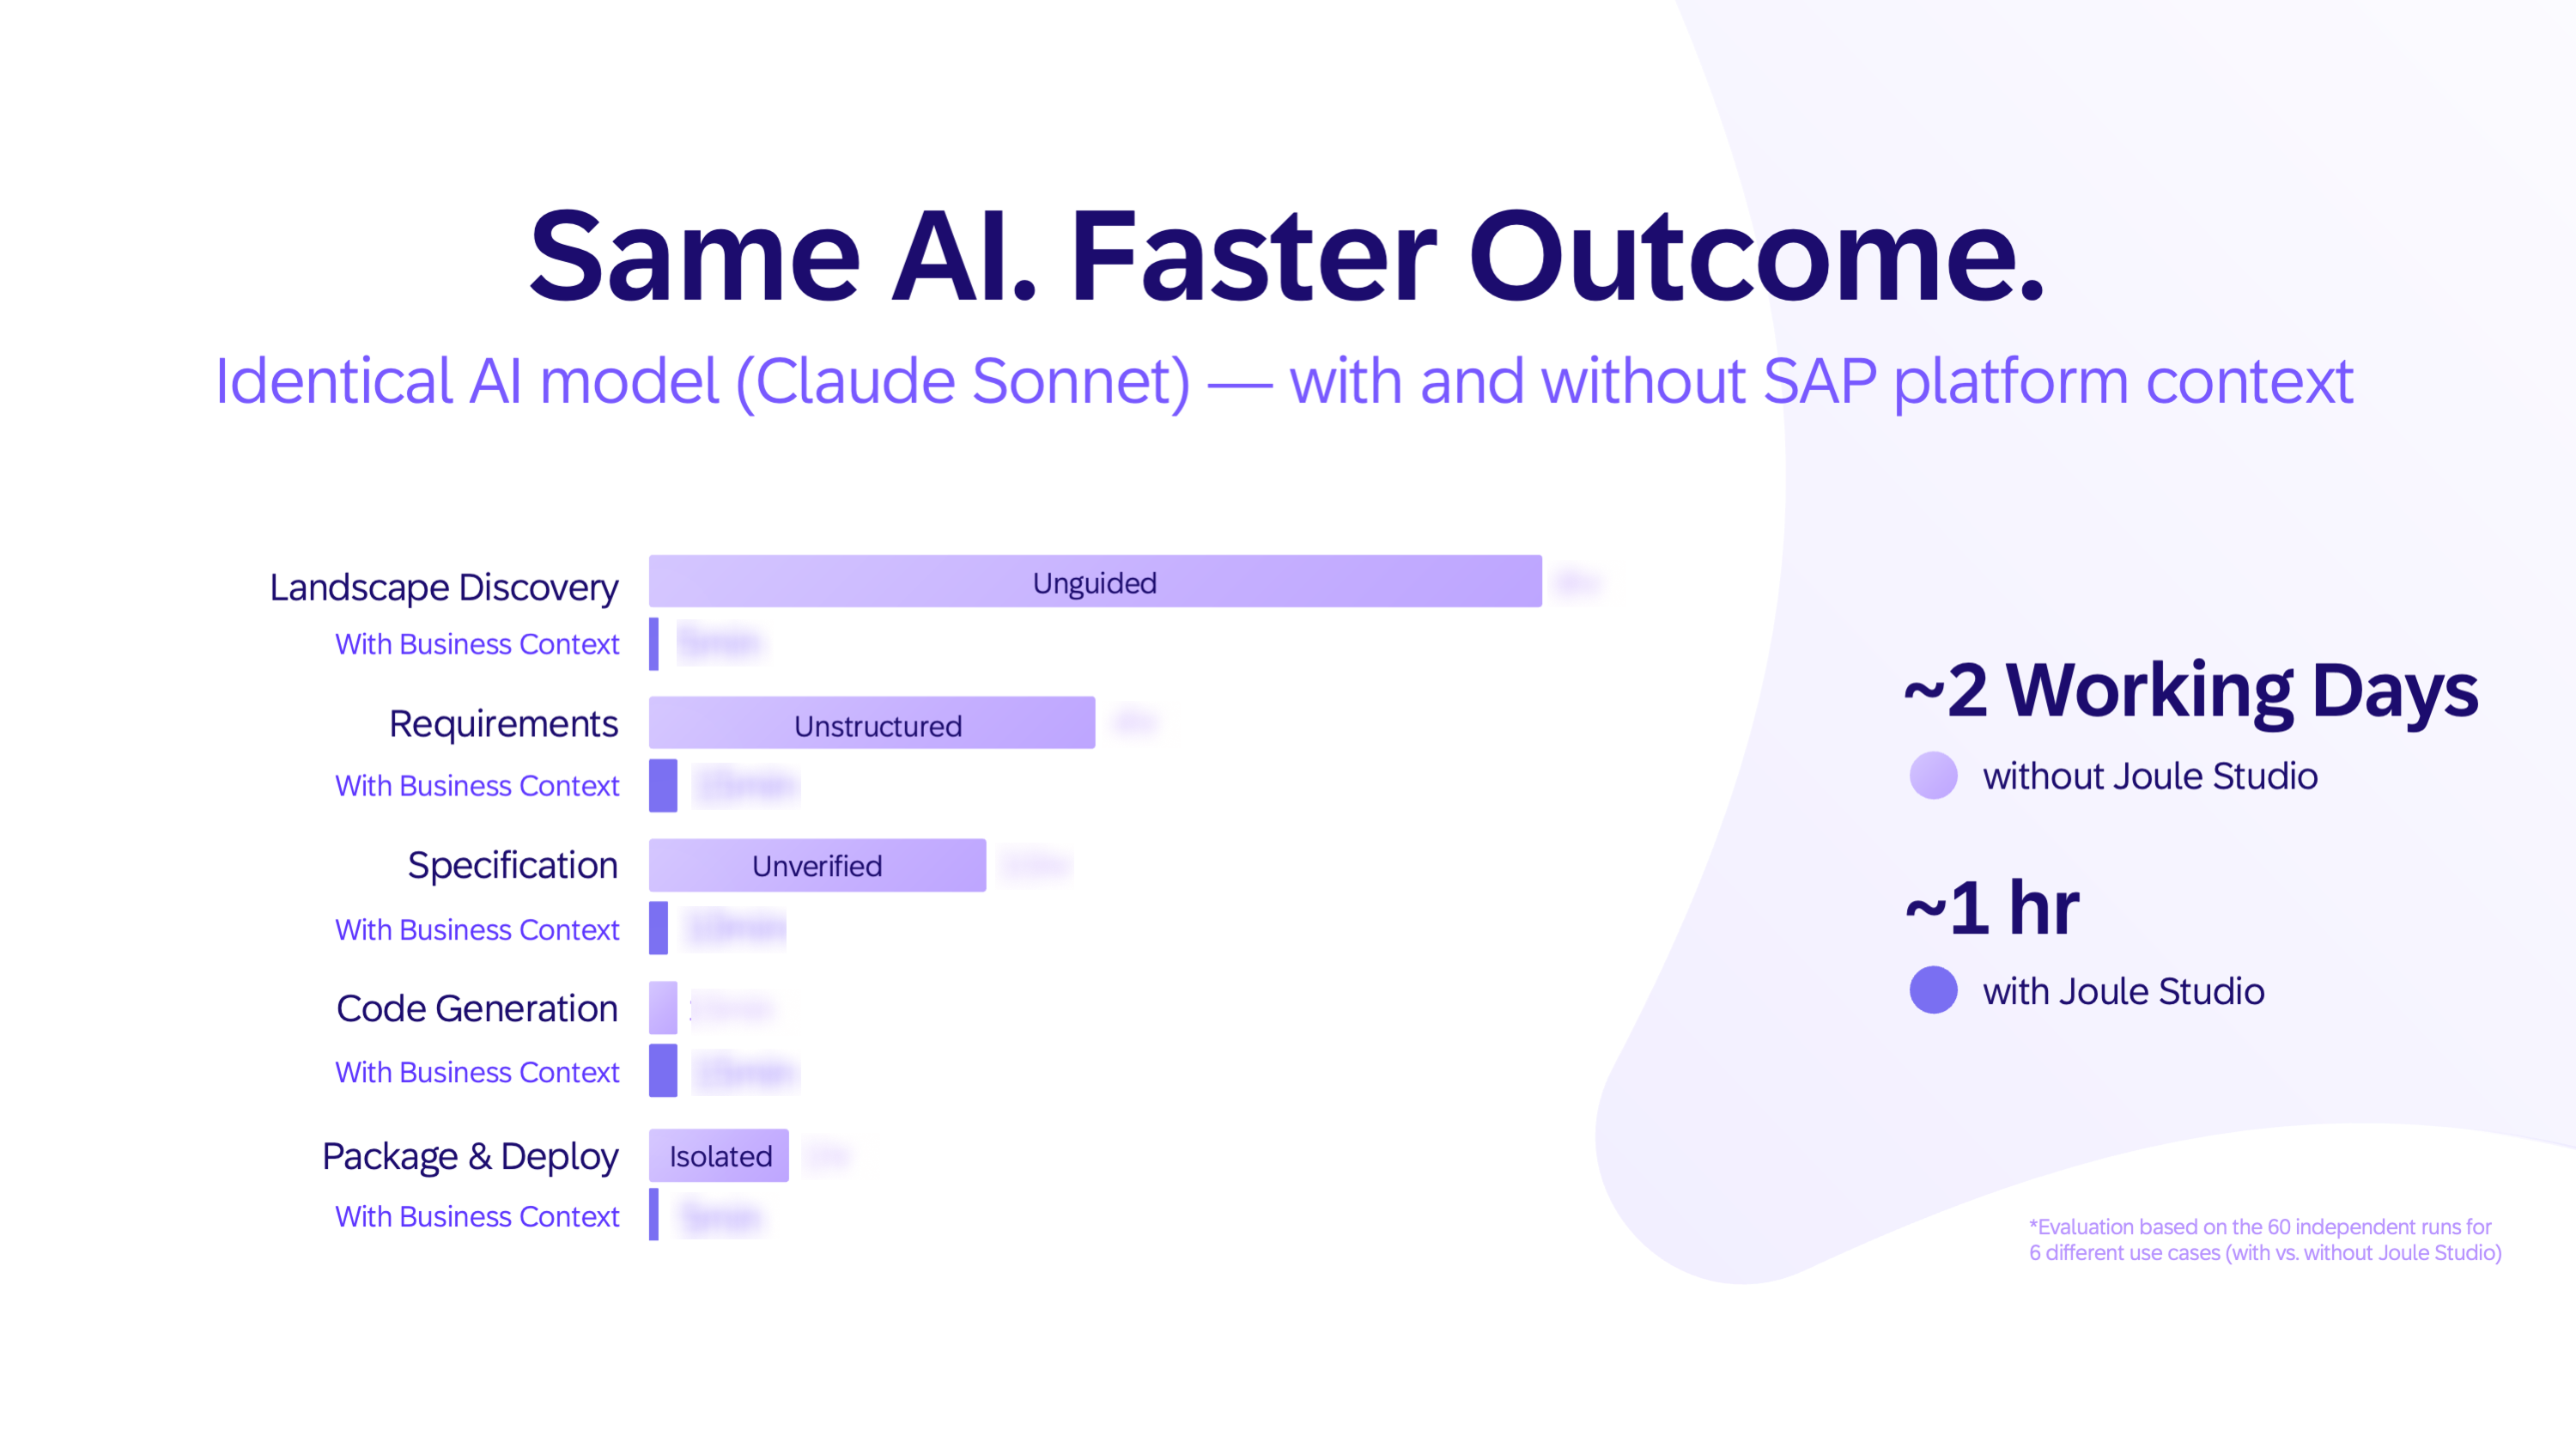
Live demos. Joule Studio: 2 days → 1 hr. €3M → €750K.
Slides 13–65
Act IV
The Govern
130K agents in enterprises. AI Agent Hub as control layer.
Slides 71–81
Act V
The Call
8 announcements. GA timeline. Physical CTA on the show floor.
Slides 82–83
Anxiety → Confidence Curve

Fear is validated first. Sparse single-statement slides prime receptivity — so the platform reveal on slide 9 lands as relief, not sales pitch.

Speaker Transitions as Visual Resets

Each guest speaker gets a full-bleed portrait slide. No copy. Signals "new voice, new credibility" and creates a natural act break.

3-Beat Announcement Formula
BEAT 1
Demo / Customer
Build desire before naming the product
BEAT 2
Announcement Slide
Pill badge + weight split + GA toggle date
BEAT 3
Stats / Quote
Quantify impact; customer voice as proof
Slide TypeConventional ApproachDesign Decision Rationale
Problem setupBullet list with iconsOne full-bleed statement per slide. Forces the audience to sit with each idea.
Platform overviewOrg chart / product mapThree-ring diagram. Communicates relationships, not just inventory.
ROI proofBar chart with axes€3M vs €750K as oversized number pairs. No interpretation required.
Partner introCo-brand slide + bulletsSpeaker portrait only. No slide competes with a person at the podium.
Technical benchmarkFeature matrix"13% better prediction quality." One number, one comparator.
Call to actionQR code + URLTwo physical locations on the show floor. Physical beats digital.
The 5 Laws of This Deck

1. One idea per slide

2. Numbers eat prose

3. One accent colour

4. Scarcity signals urgency

5. Presenter wins

What This Deck Deliberately Avoided
Bullet lists
Slide numbers and chrome
More than 3 colours per slide
Auto-advancing animations
Stock photography
Communication Design Documentation  ·  SAP Sapphire CIO Keynote 2026  ·  Michael Ameling Stage Team
Design Portfolio · 2026